Executable example · practical
Render a bar chart
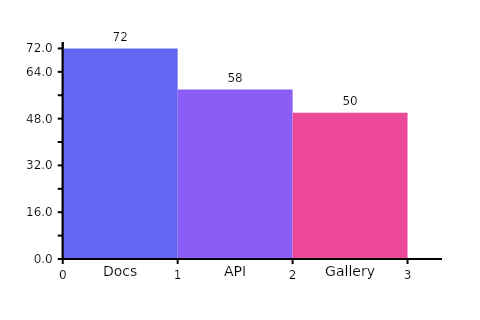
Render a practical bar chart as a verified 480×320 PNG through ApexPainter.createChart().
✓ VerifiedRuntime: nodeapexify.js
Prerequisites
- Node.js 22, 24, or 26
- apexify.js 6.0.0
Authoritative source
SOURCEtypescript
typescript
Source hash: cd7a888b8b826223996d9aa4d2a7769e6eed61bc8753315d90bd594d838c8baa. The displayed payload is generated from the files executed by DOC-5 verification.
Goal
Turn structured bar data into a server-generated chart image.
Important options
chart type: bardimensions.widthdimensions.height
Why these choices
- A fixed chart type keeps the example focused.
- Explicit dimensions allow PNG metadata verification without pixel-fragile golden tests.
Variants
- Use the same createChart API with pie, line, scatter, radar, horizontalBar, or polarArea data shapes.
Performance note
Chart rendering is CPU-bound and local; this example intentionally uses three bars.
Error note
Malformed chart data or non-finite numeric input is rejected by Apexify.js validation.
Related documentation
Related API
Next steps
Combine rendered output with application metadata as shown in node.integration.report.