Executable example · integration
Build a multi-file chart report
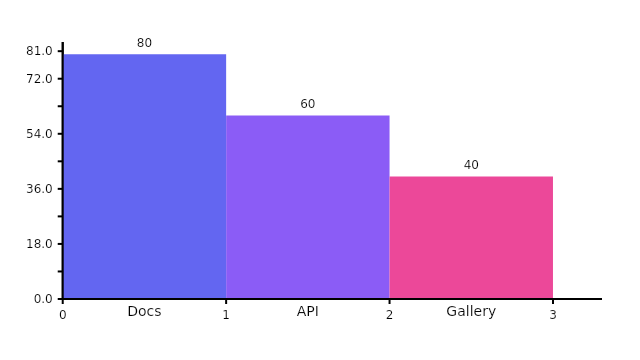
Use a typed data module plus ApexPainter to generate both a report chart and exact JSON summary.
✓ VerifiedRuntime: nodeapexify.js
Prerequisites
- Node.js 22, 24, or 26
- apexify.js 6.0.0
Authoritative source
Source hash: e319c93d86cacdf025a04d5601b3c523e710962d96d83e8eac564f8b8c97e52b. The displayed payload is generated from the files executed by DOC-5 verification.
Goal
Prove a realistic multi-file example that produces more than one independently validated output.
Important options
bar chart datadimensions
Why these choices
- Data lives in a separate typed module to prove multi-file fixture copying.
- The PNG uses metadata verification while the JSON summary uses exact semantic verification.
Variants
- Replace the report data module with application data while retaining the same rendering boundary.
Performance note
The fixture creates one 640×360 chart and one tiny JSON file; no remote resources are loaded.
Error note
Type errors in the imported data module fail before execution; output contract mismatches fail after execution.
Related documentation
Related API
Next steps
Link the same stable example identity from feature guides and API reference metadata.